
Examining App Viability
Nov 2022 - Jan 2023 @OneDegree
Assessed user receptiveness to the OneDegree mobile app by tracking installations and engagement, providing key insights for future development and UX strategies while standardizing the testing workflow
PLATFORM
Progress Web App
REGION
Taiwan
WHAT I DID
Experimental Design
Data Analysis on Google Analytics
ACHIEVEMENTS
Building a data-driven culture through standardized testing workflow.
Determined the product strategy of whether we should invest the resource in developing an app.
38% of iOS and Android users willing to install (accepted the invitation)
30% of Android users completed the installation.
Compared to other users, installed users spent less time on a page, but stay longer and view more pages in a session.
Goal
The study aims to understand user interest in downloading an app via a Progressive Web App (PWA) feature:
How many current users will be interested in installing a mobile app provided by ODHK?
How many users browse ODHK website using home screen app?
Methodology
A dialogue will pop out to ask mobile and tablet users if they want to install OneDegree website to home screen when users successfully log in to OneDegree dashboard. We will then record the number of users accept the invitation (i.e. Click on “Add“ button from the dialogue), the number of users who view the website from the home screen shortcut, and their further behaviors.
The dialogue won’t show in the following scenarios: (1) User is browsing via the app, (2) user clicked "later" in the past 3 days, and (3) user has clicked on "Later" button 3 times.
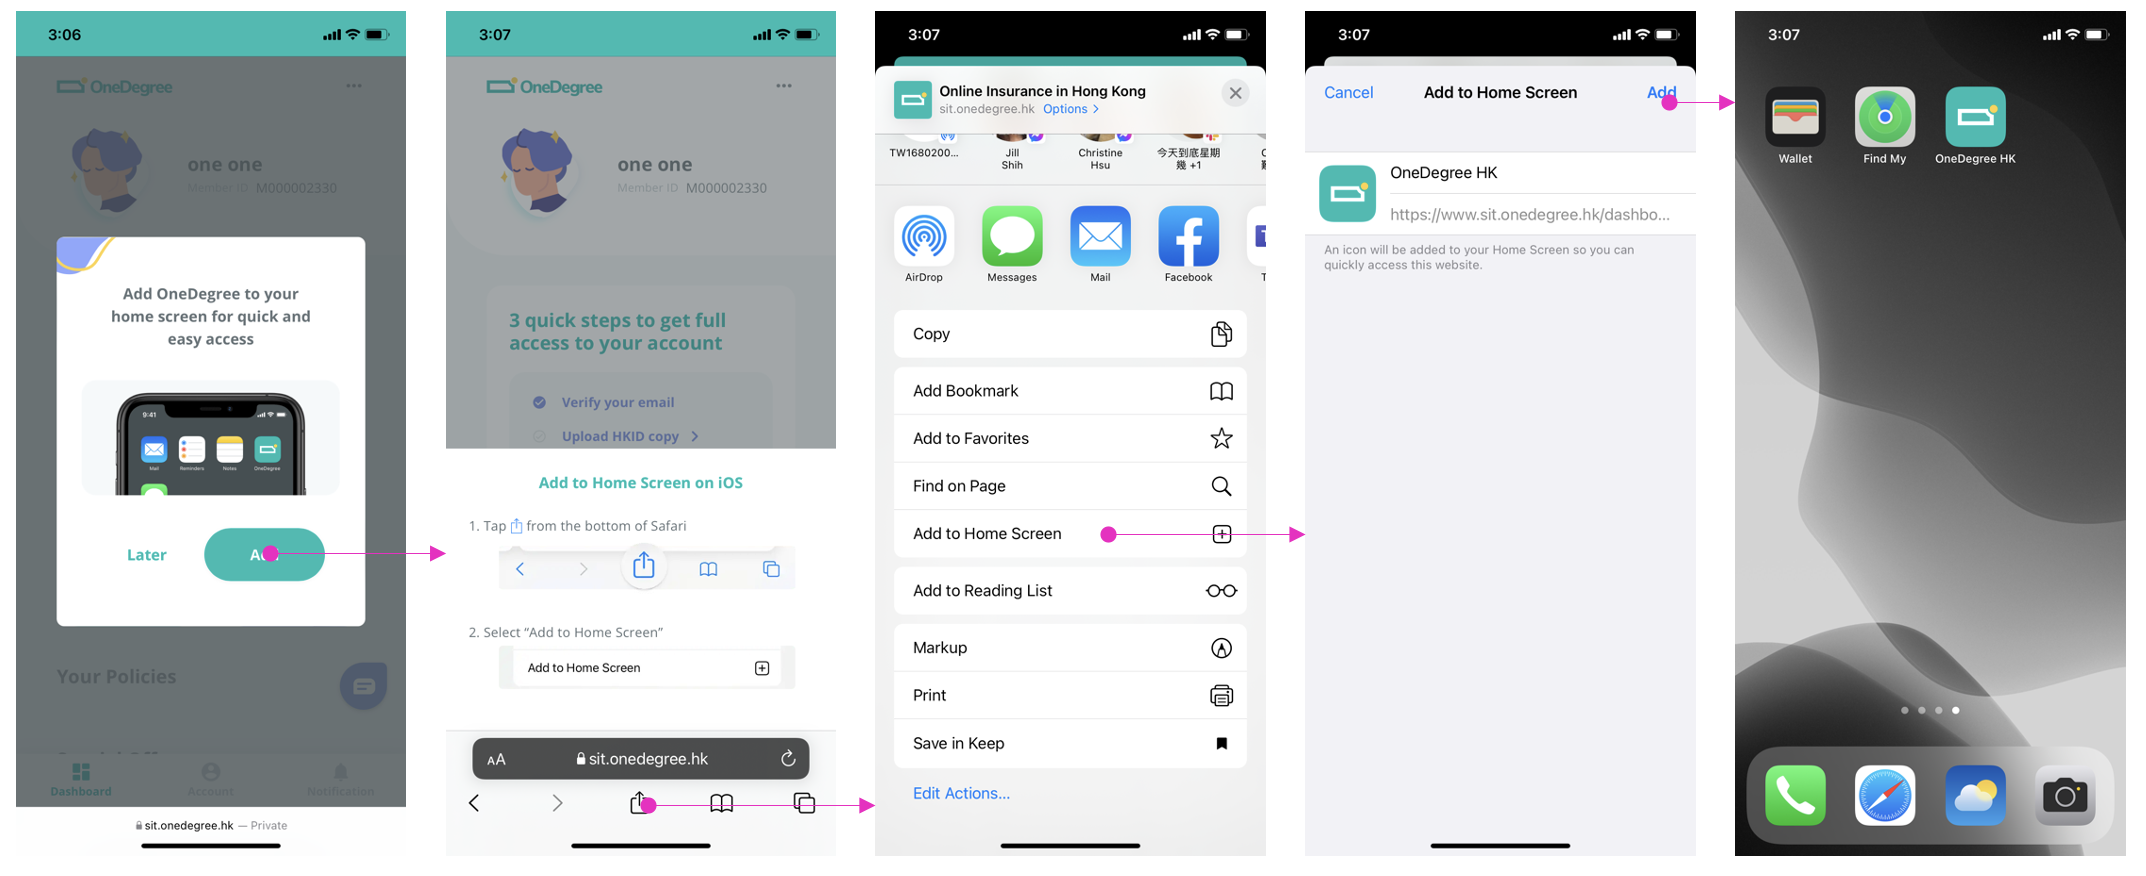
Flow of installing PWA on iOS
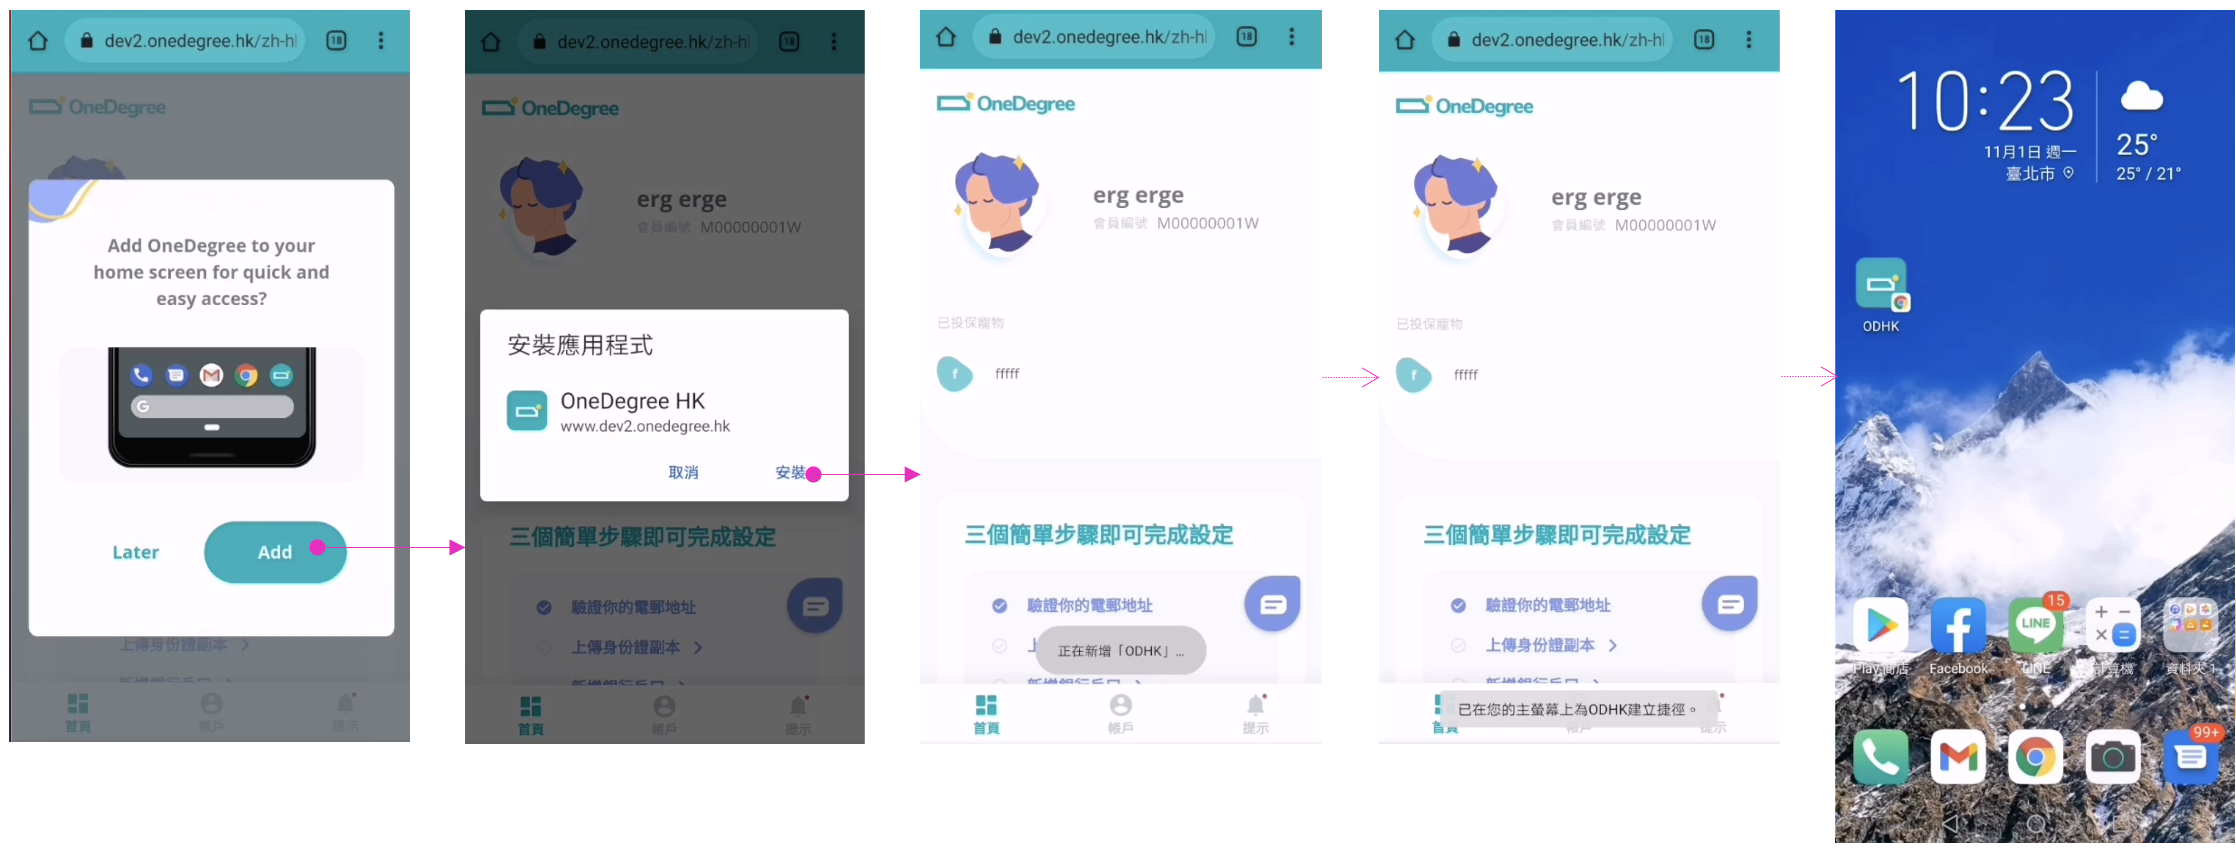
Flow of installing PWA on Android
Participants
Only users who have accounts (i.e., policyholders) can see the dialogue because the app is designed for easy to manage their policies and use related service. The counts of users clicking Add/Later button and the number of users using PWA to browse are recorded.
We only record iOS-Safari (Device – Browser), Android- Chrome and Android- Samsung browser because of the technical limitation of PWA. Nevertheless, the three groups already include 86% of OneDegree mobile users.
Results
Intention
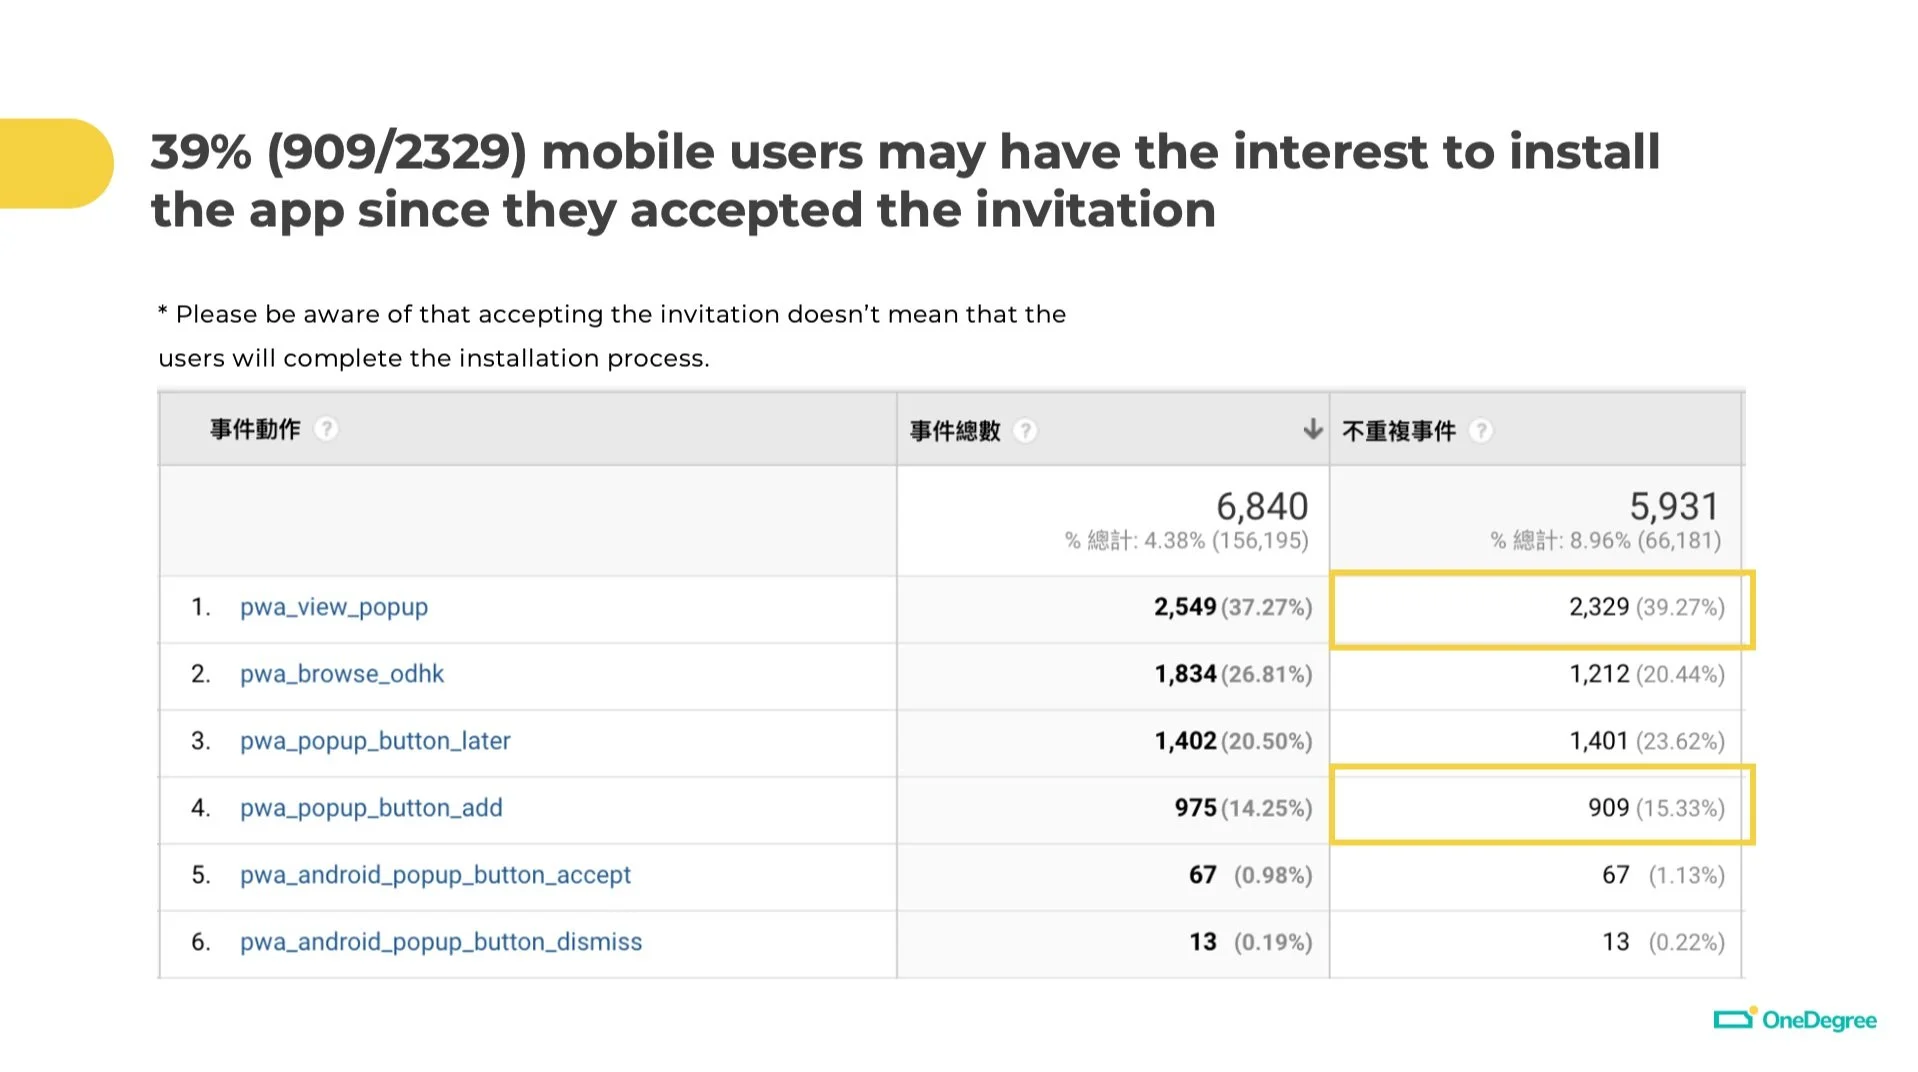
Out of 2,329 users who saw the pop-up (2,067 on iOS and 262 on Android), about 39% (909 users) accepted the installation invitation. However, accepting the invitation did not necessarily mean that the app was installed.
Behavior
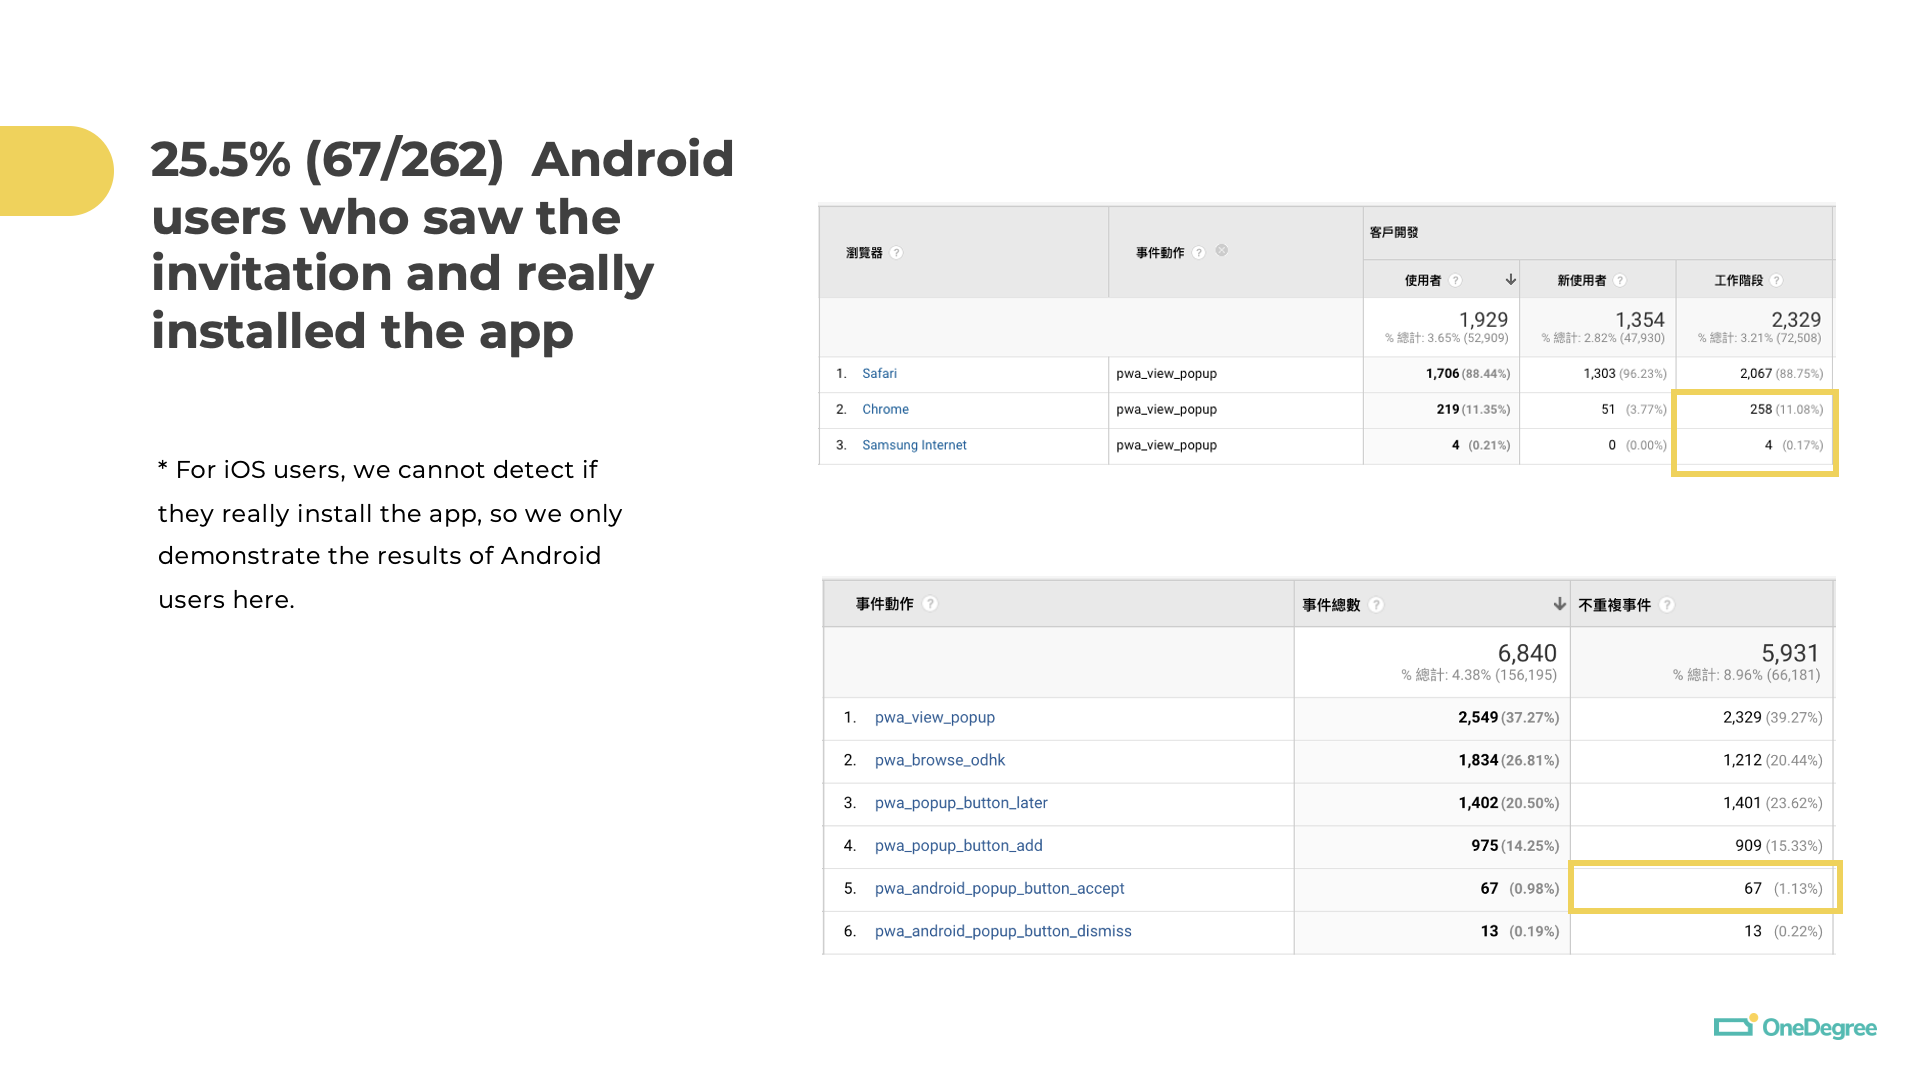
For Android users, 25.5% (67 out of 262) of those who saw the invitation actually completed the installation. The installation status for iOS users couldn’t be tracked due to system limitations.
The top pages visited by installed users were the Dashboard, Sign-in page, Settings (including bank info), ODHK Home, and Vet network.
Limitations
The study also acknowledged several limitations, such as the short duration of data collection, the inability to track actual installations on iOS, inclusion of OneDegree employees in the data, and the fact that only signed-up users (policyholders) could see the installation notice.
Standardizing the Testing Workflow
I structured and documented the project workflow and collaboration process, creating a step-by-step SOP to standardize future data-driven testing and improve efficiency. This initiative fostered a team-wide mindset for data-driven decision-making, embedding it as a core practice in our workflows.

