Evaluating and Benchmarking Virtual Keyboard
Mar 2015 - Jul 2015 @HTC
The core experience of HTC Sense Input, specifically its ability to effectively assist users in correcting typos, was systematically evaluated, analyzed and benchmarked.
PLATFORM
Mobile App
METHOD
Experiment, Usability testing, Competitive analysis
REGION
United States
WHAT I DID
Defined indicators for measuring correction performance
Experimental design
Quantitative data analysis
ACHIEVEMENTS
The studies provided insights to a question that was previously unanswered within the company: "What is the precise evaluation of the input method engine (IME) in terms of its performance?"
Created an automated testing approach to consistently assess the product quality at each iteration
Gained insights into user preferences for a virtual keypad, including layout, correction, symbol accessibility, and familiarity.
Collected 4500 common vocabulary typing logs for future evaluation.
Overview
How to determine whether the new keyboard performed well or poorly?
The new engine vendor "X" claimed superiority over the previous engine "Y", but this conflicted with negative feedback from internal users who reported issues with prediction or correction on the keyboard using the "X" engine. However, the root cause of these problems with the new engine remained unclear within the company.
To ascertain the quality of the engine, we conducted two studies.
The first study involved a systematic evaluation and comparison of correction performance between the two engines, tracking improvements across versions from the vendor "X".
The second study entailed comparing the enhanced X engine with other competitors in the market.
Study 1
Assessment of Correction Performance and Automated Testing
45 native English speakers typed six scripted messages and three free-form messages, using two keypads that have the same layout but with different engines.
Testing Materials
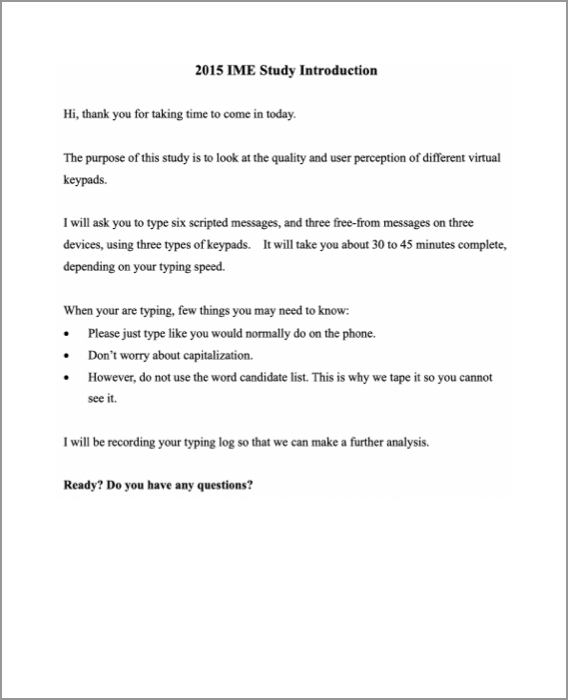
Instruction
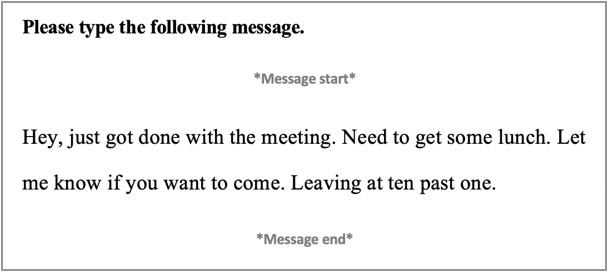
Typing Script Sample (Pre-defined, participants were asked to type in the experiment)
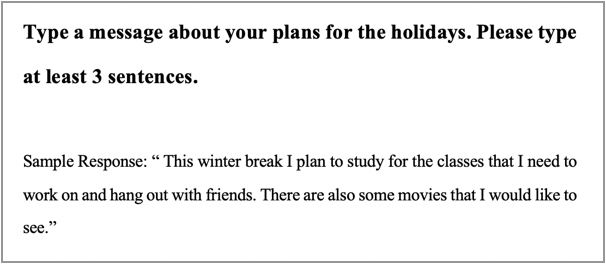
Typing Script Sample (Free form, participants asked to type freely)
Data Analysis
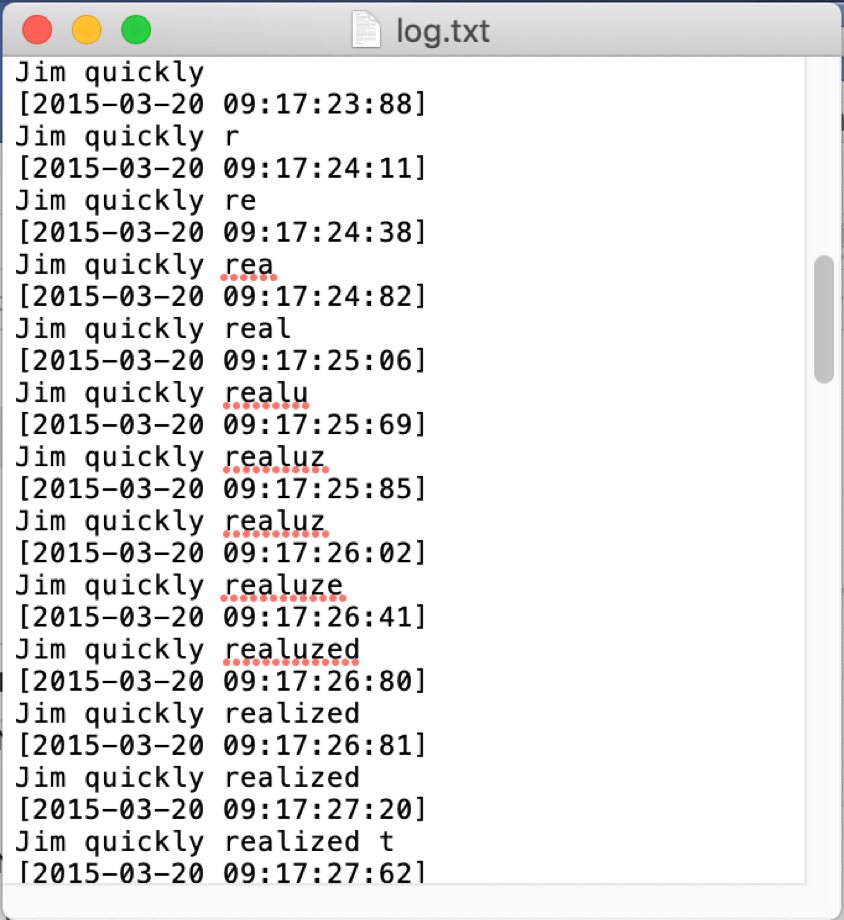
Typing Log (raw data that shows every characters participants had typed)

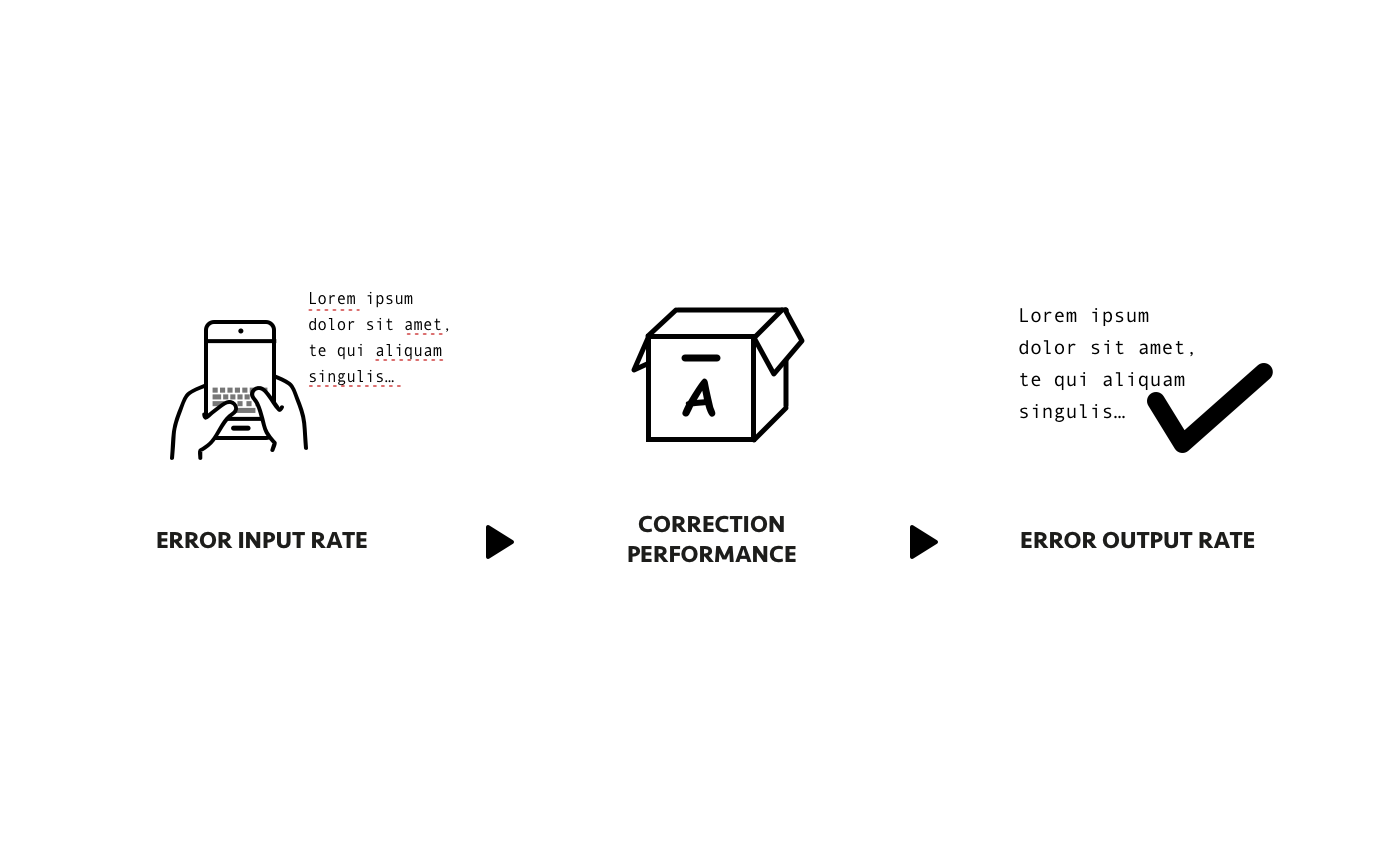
After parsed, the data were categorized into three types:
Script: what users were supposed to type
User input: what users really typed
IME output: the final texts after auto-correction
We then calculate these indices for further analysis, and then calculate the correction performance of the keyboard.
W1 : The number of words that users input incorrectly (user input vs. script)
W2 : The number of wrong words in the final texts (IME output vs. script)

Results
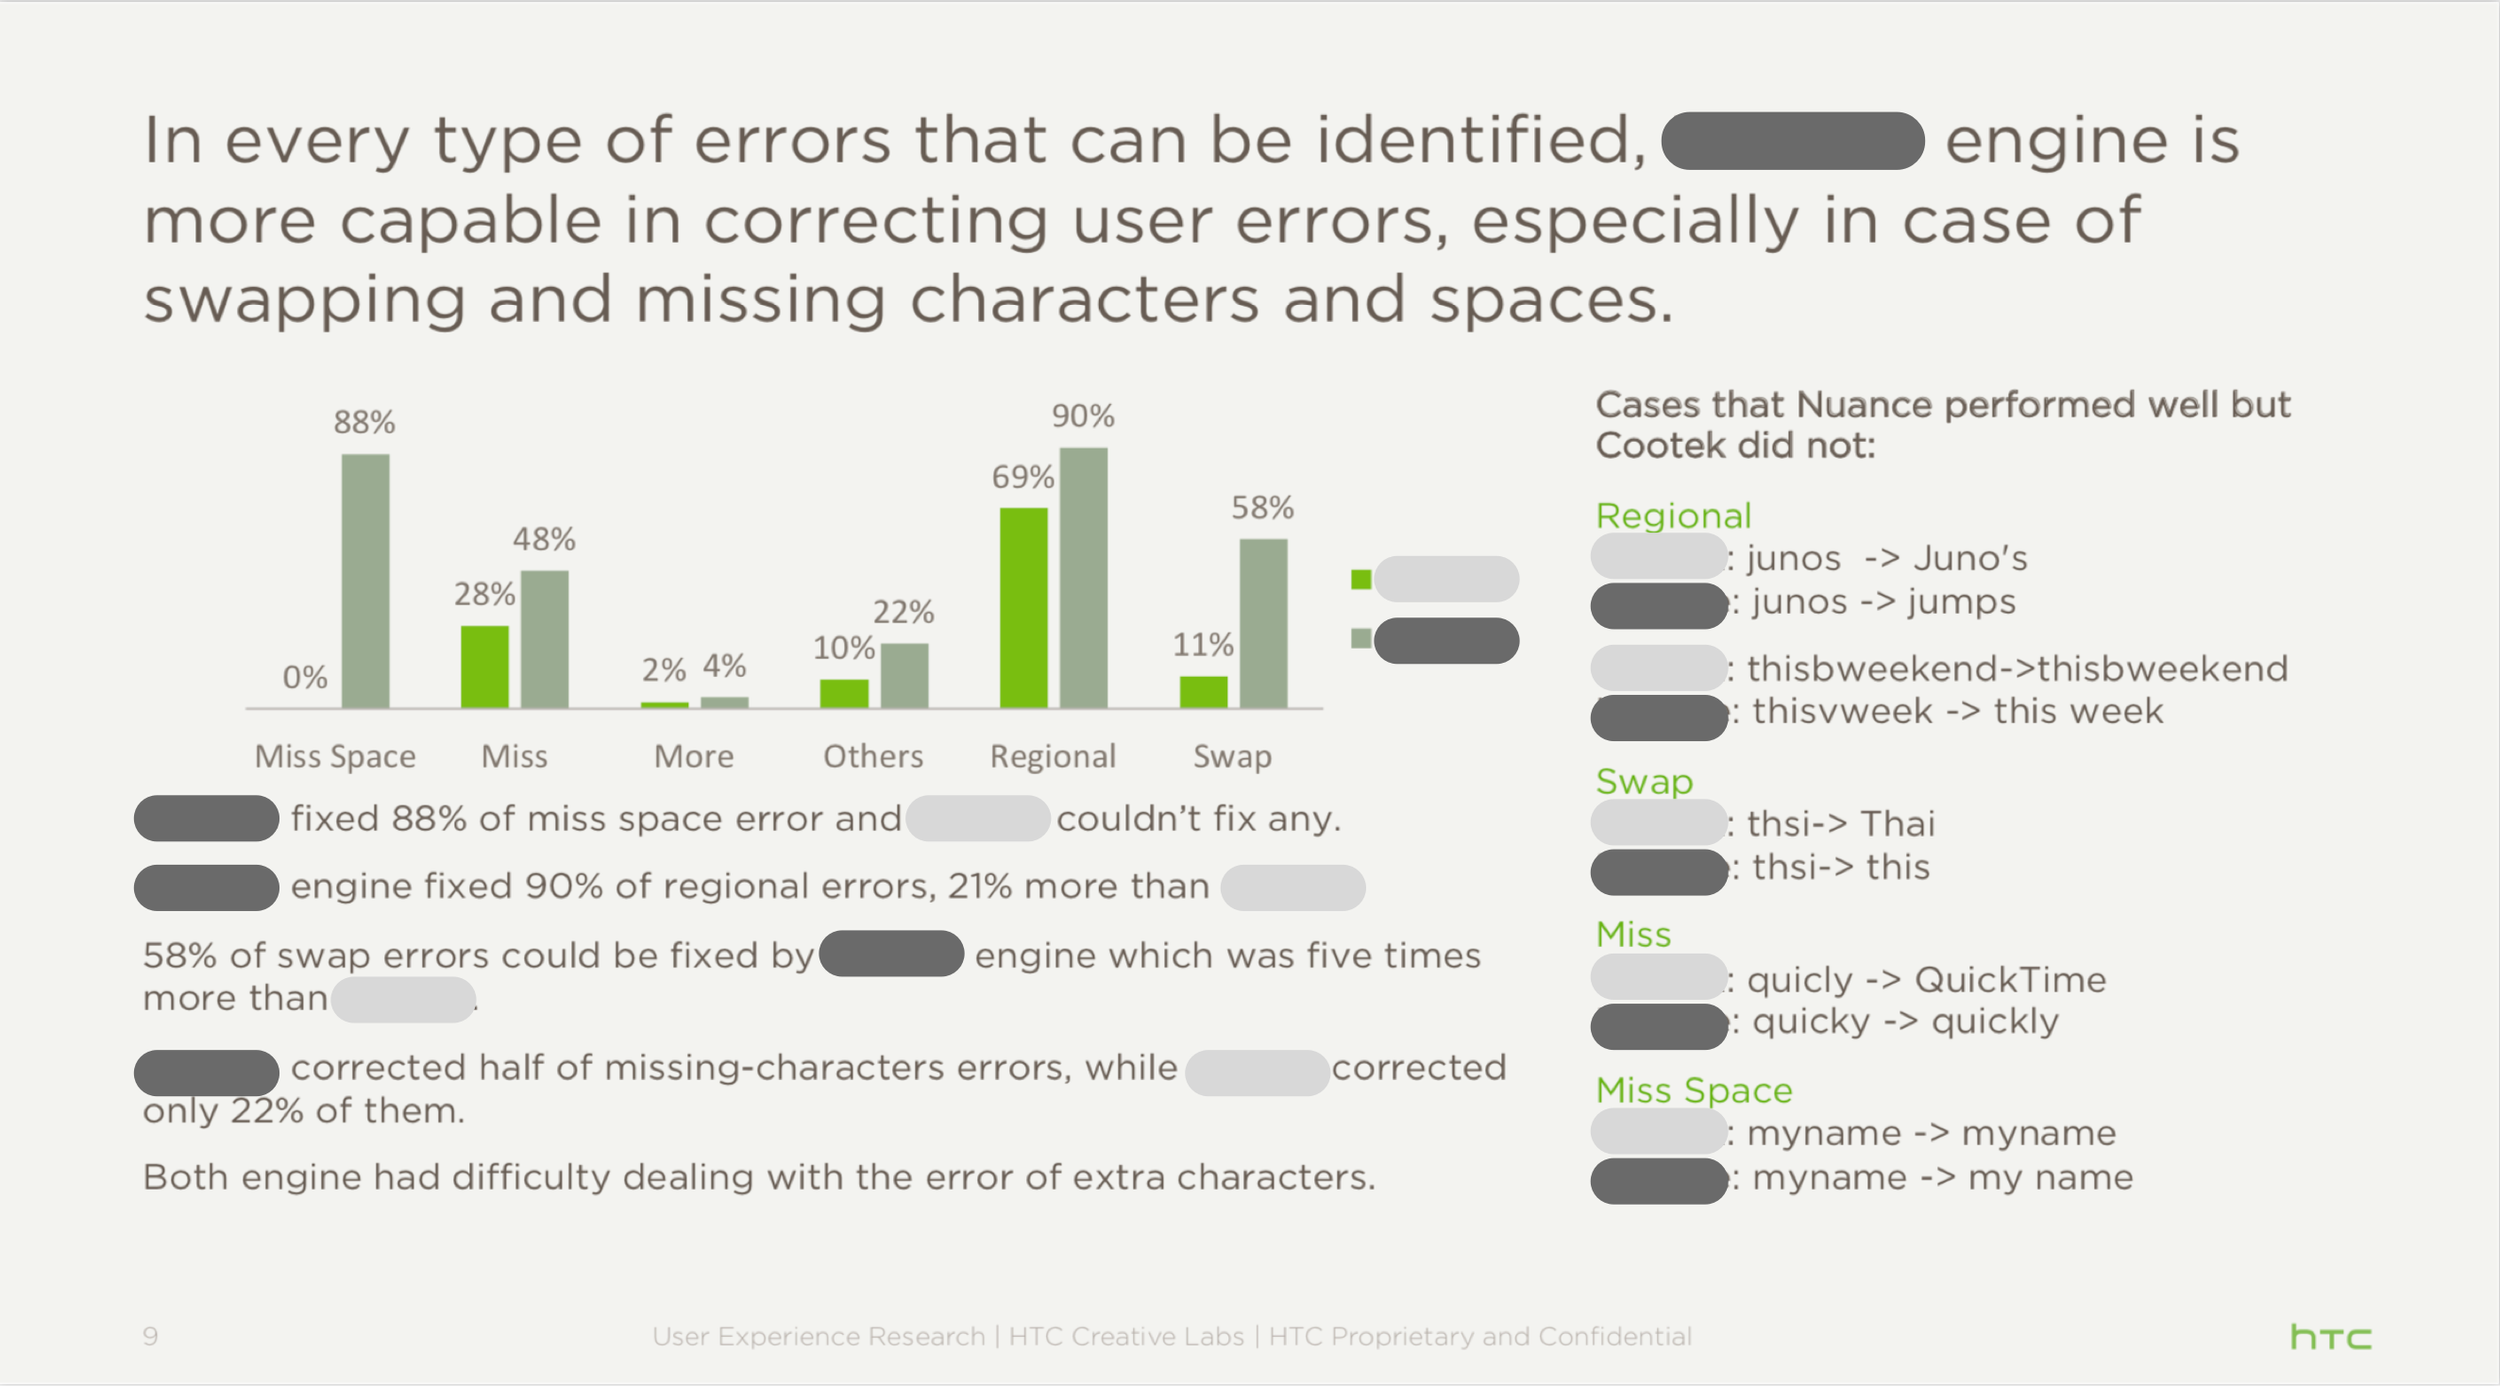
Correction Performance by Error Types
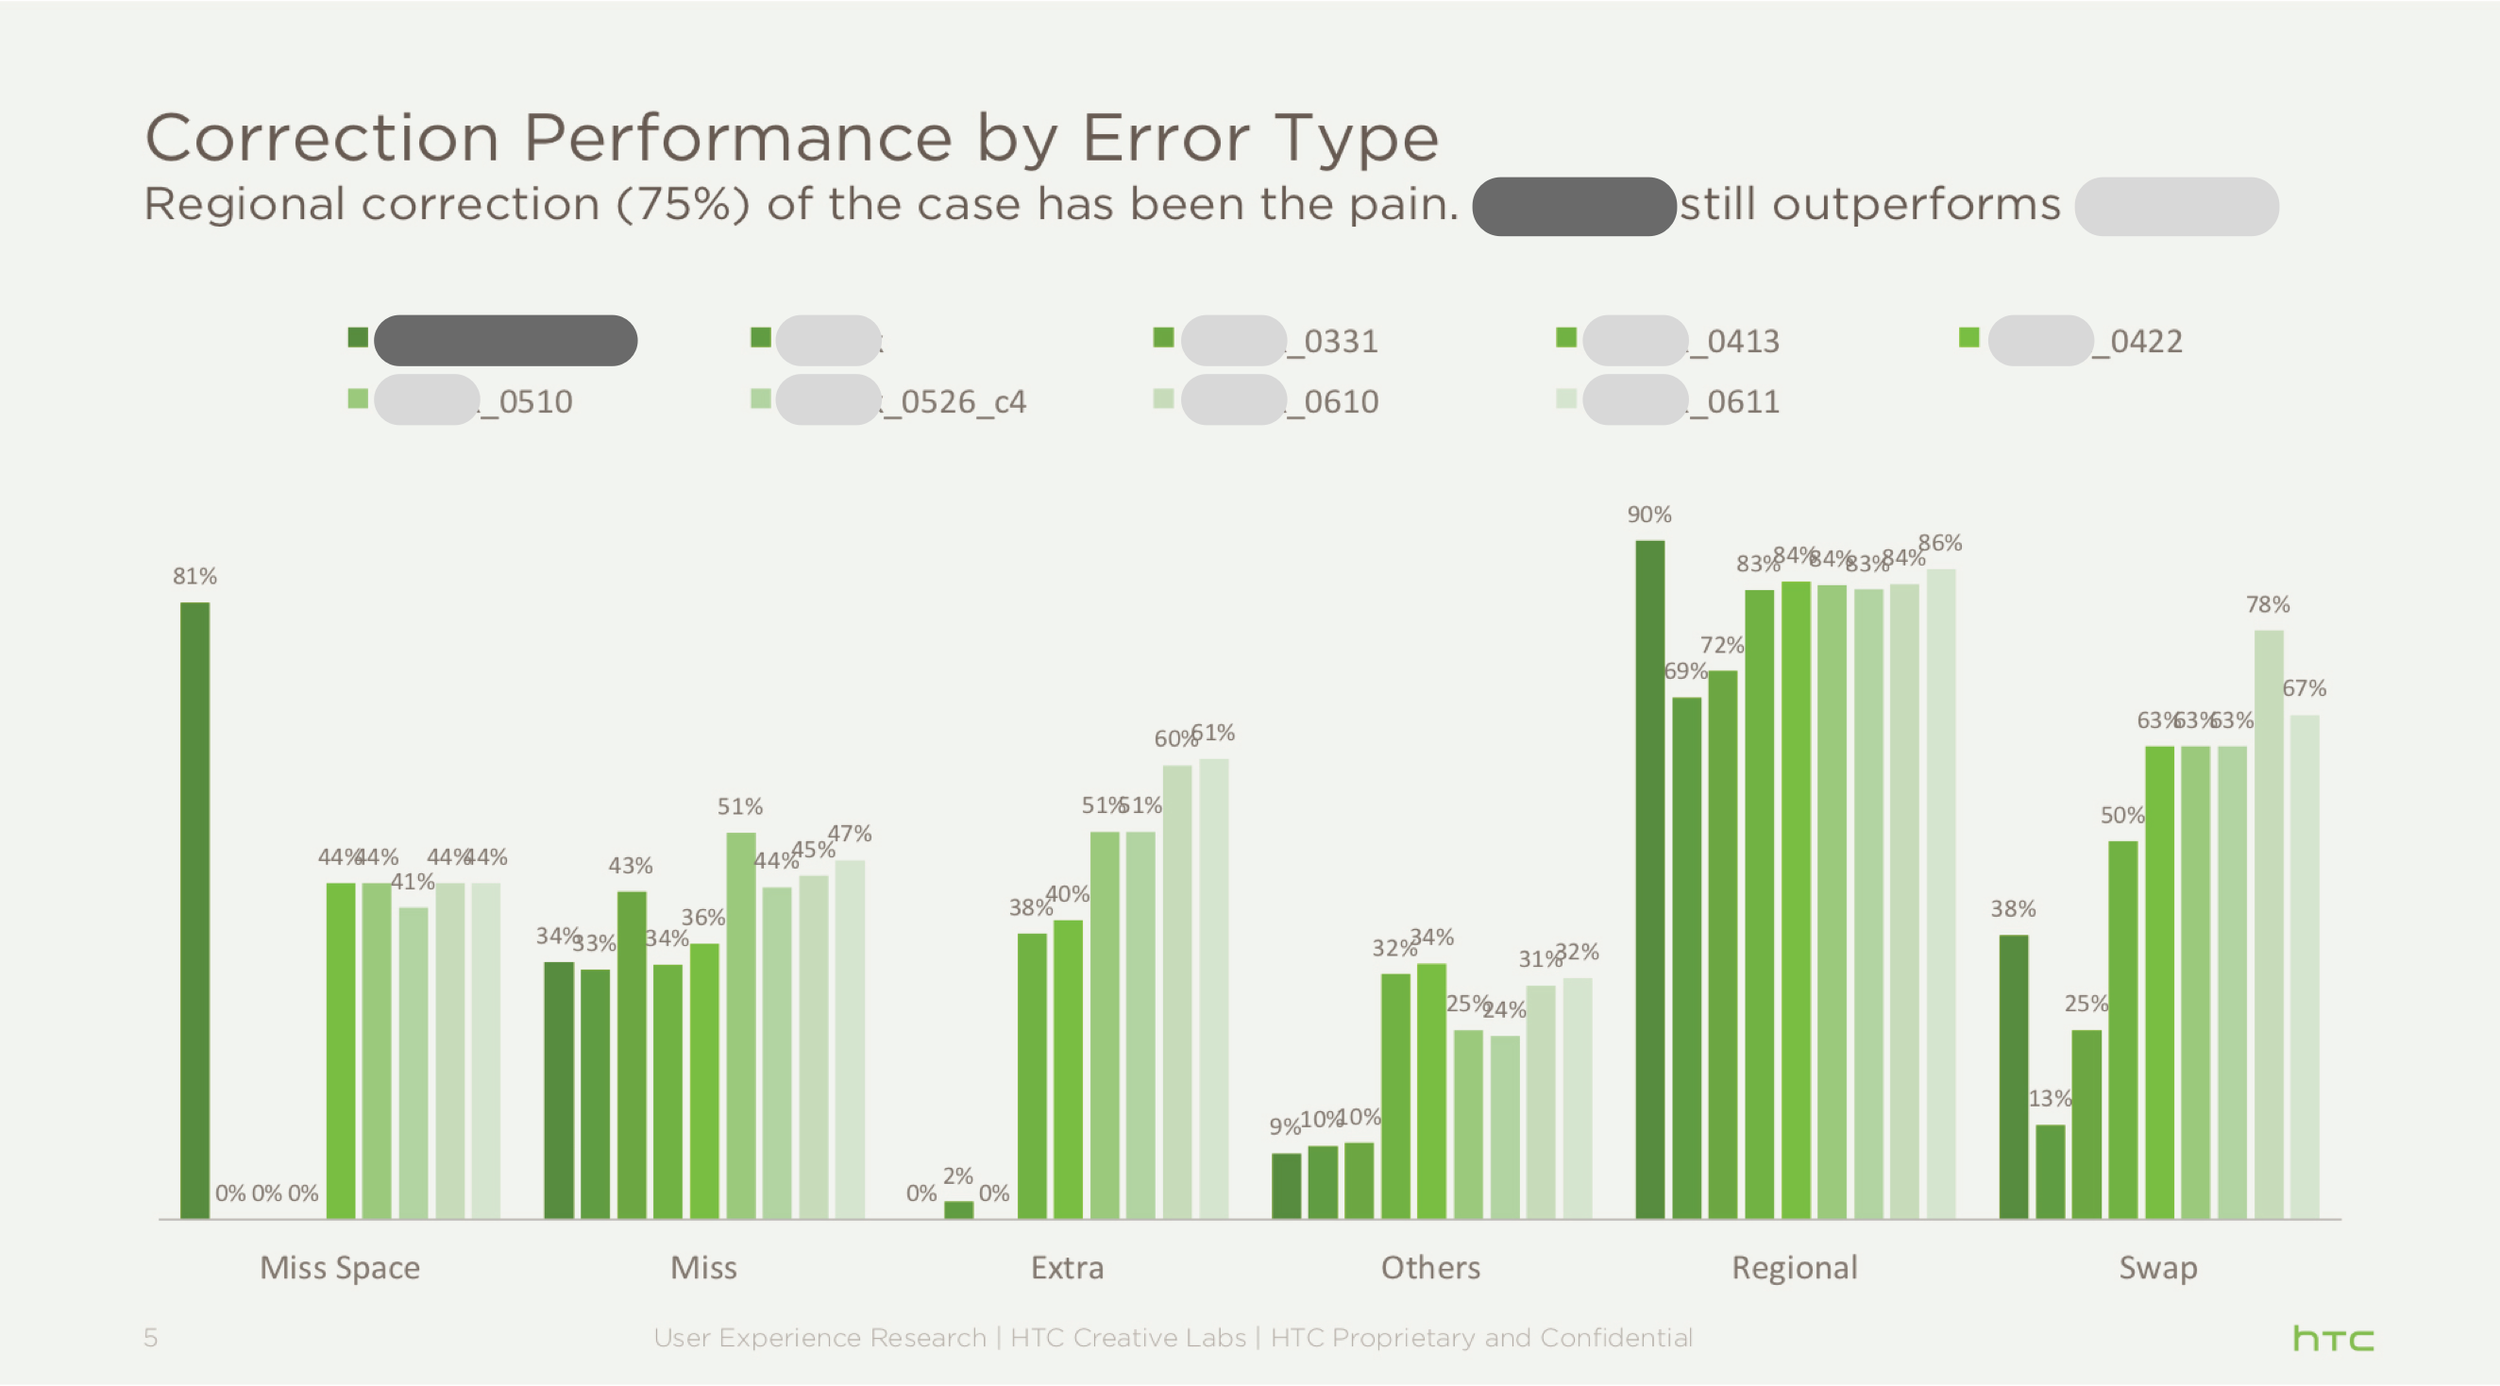
Auto-testing and Improvements Tracking
Qualitative Analysis
Study 2
Benchmarking
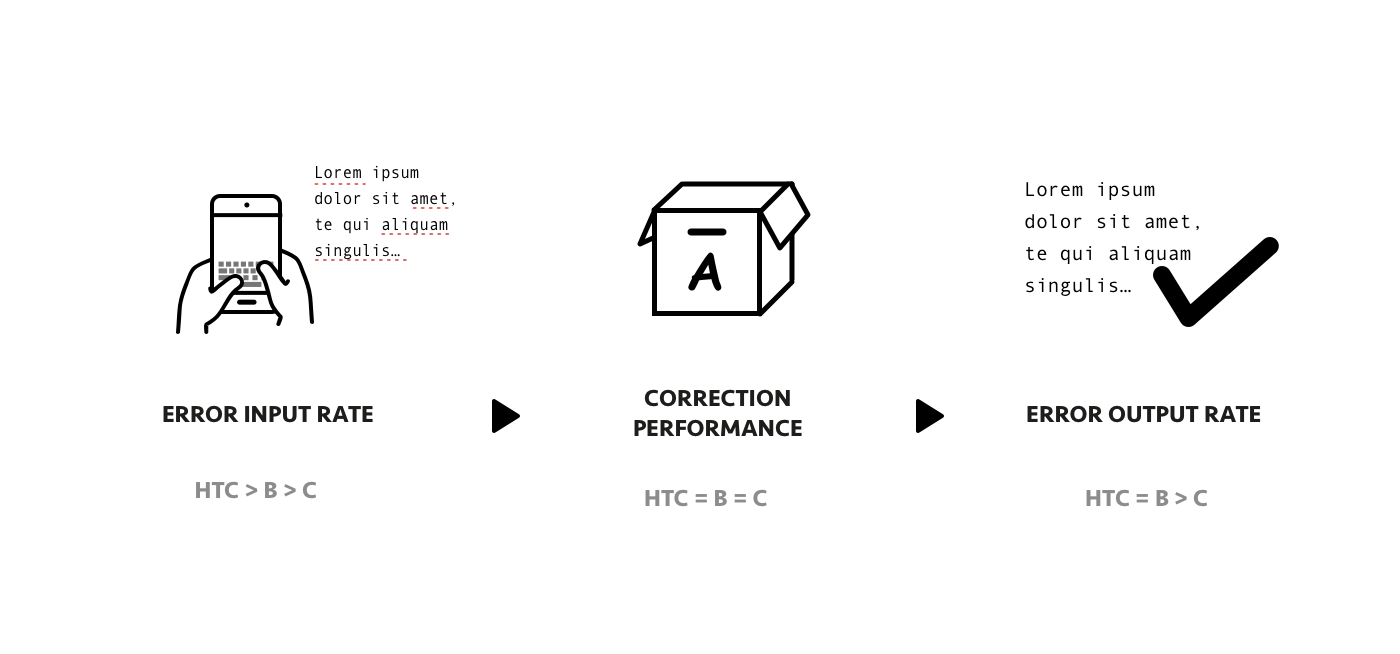
63 native English speakers typed three or six short paragraphs, using HTC, A and B keypads (same device), and then filled in the questionnaire about their preferences.
Testing Materials

In order to obtain a wider range of typing data, users were requested to type a script that was curated from online news sources this time.
Results
It was observed that the existing input engine demonstrated comparable performance with both A and B keyboards in terms of typo correction. However, the error rate of typing output was significantly higher compared to other factors, which was attributed to a higher rate of input errors.